

SIPBS BMS Data
The SIPBS building is equipped with a state of the art Building Management System (BMS)that monitors various parameters within the building and controls operation of energy HVAC) systems. The values of these parameters can be viewed on the BMS user interface located within the Estates Services (ES) building.
There is a detailed breakdown of all the floors and rooms within the building, including the HVAC supplying each area, all accessible, visually, through the user interface. All data involved with a specific HVAC system could be monitored. However, the system, and its user interface, is limited in its ability to show and display information in that data for a certain parameter can only be seen if the user asks for this parameter to be trended, meaning dynamic parameter data within SIPBS could not be seen unless it is trended. This implies that any problems with the HVAC systems or issues within an area may go unnoticed, especially when the system is used reactively rather than pro-actively.
Trended data can then be viewed or downloaded for analysis. Also, the BMS does not keep trended data or record for more than three months. The data must therefore be backed up after this period or lost.
The building has sub meters for equipment with electrical consumption greater than 50 kW, in line with regulations, which are fed into the BMS. This means that electrical consumption of each of the chillers, AHUs, small power and lighting per floor (and many others) could be seen independently from other electrical consumptions allowing analysis of electrical consumption to be disaggregated. The boilers, humidifiers and labs also have sub metering for gas consumption.
Trending Data
The team requested for some parameters to be trended. Each parameter had a certain code associated with it which meant that the user interface had to be explored to find necessary parameters for trending.
When this data is received the time base can be adjusted to the desire of the user. This can be in 6 minute, 30 minute, 1 hour, daily or monthly averages depending on the parameter measured, length of time measurements are taken and for whatever purpose the user requires the data (data is initially captured in 6 minute averages). There was need to copy and pasted trended data into excel for clarity and better understanding because the data as displayed on the user interface is overwhelming and difficult to understand.
BMS Results
The data obtained were reproduced graphically and are shown below. They are categorised under Gas Consumption & Heating and Electrical consumption. The data (statistics) and graphs were then used for Performance Evaluation.
Gas Consumption & Heating
Gas consumption was obtained from sub meter readings for the boilers, humidifiers and the labs as cumulative total volume in m3. Hourly gas consumption was calculated (again in m3) and converted to energy values (kWh) by multiplying by 11.13 (Energy Saving Trust). The results produced are shown below.
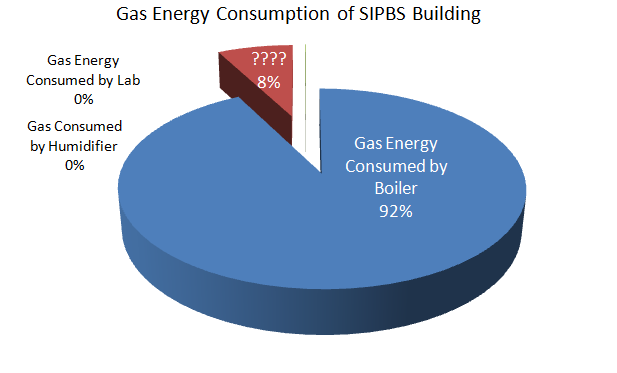
As can be seen from the figure, vast majority of the gas consumed by SIPBS is by the boilers. Laboratory gas consumption with respect to the boiler consumption can be considered zero or negligible. This implies that almost all of the gas supplied to SIPBS was used to provide thermal comfort.
The team found about 8% of energy unaccounted for. This is an indication of how difficult it is to work with BMS system as is stands as it shows there may be calibration issues within the system and its devices, a bug or inaccurate data.
The graph of boiler state (on/off) and gas consumption data for boiler 1 over a 24 hour period is shown below.
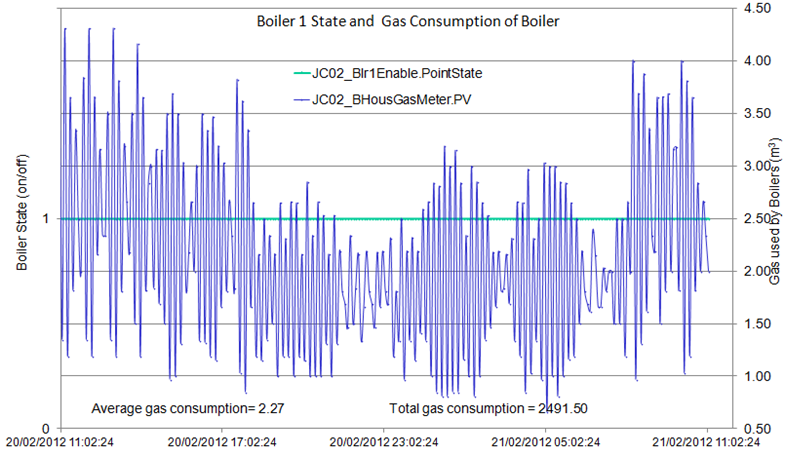
This shows the boiler working over a 24 hour period and consuming gas/energy. It was expected that out of office hours, particularly very late at night and early morning, the boiler would be off and not consuming gas. Although gas consumption drops during the night and early morning, it is never zero and averages to around 1.8 m3. This is an indication that there may be scheduling issues with the boilers and the heating of rooms/zones/spaces. One of the factors responsible for the building consuming more energy than expected and for increased operational costs.
Electrical Consumption
Some electrical parameters were also trended to assess how the electrical energy consumption was affecting thermal comfort and user satisfaction. The results are shown below.
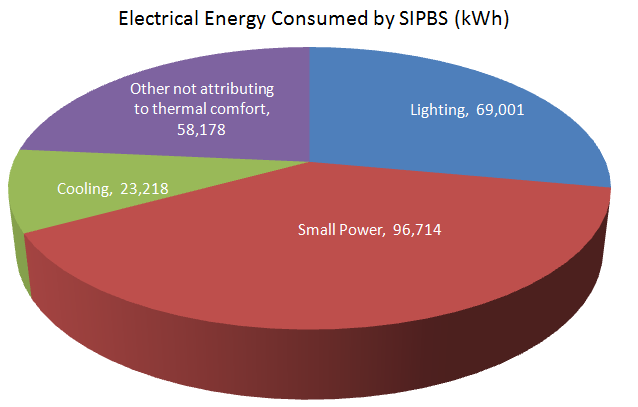
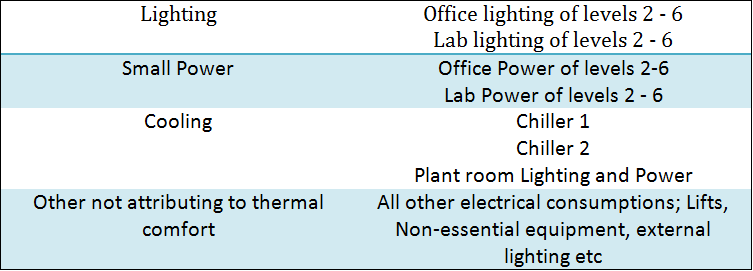
Similar to the gas consumption, the electrical data was given as a cumulative total which had to be converted to hourly energy consumptions. This electrical data was also sub metered as shown in the table
It can be seen from the pie chart that lighting and small power account for a huge proportion of the electrical consumption, 67%, which contributes to thermal/heat gain. This highlighted the importance of examining electrical data, since two thirds of the buildings electrical consumption will indirectly heat the building. The data were also carried forward for performance Evaluation and modelling and simulation.
The chillers in operation accounted for 12% of the buildings electrical consumption which was unexpected in a typically cold climate like Glasgow, especially during the winter and early spring months. The team believed there were several different reasons for this such as high internal gains from lighting and small power (especially with additional appliances in operation which were unaccounted for during design stages) and the poor scheduling and operation of the heating systems. Meaning a higher level of cooling was required, resulting in higher energy consumptions and higher operational costs.